STEAM Challenge: Chromatic Cartography
STEAM Challenge: Chromatic Cartography: Explore the intersection of art, mathematics, and computational thinking.
The Challenge:
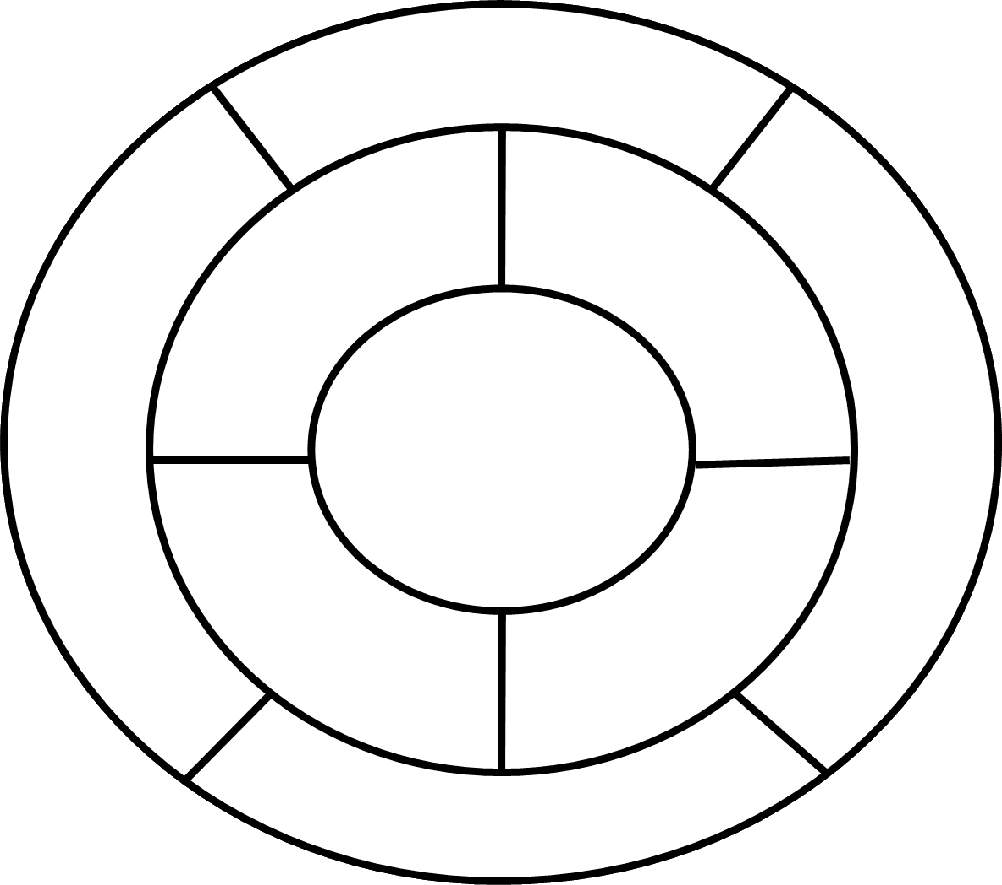
Given a specific image (a map, diagram, or abstract network of regions), your objective is to determine the absolute minimum number of colors required to color every region such that:
- Every region is colored.
- No two regions sharing a common border ever have the same color. (Regions that only touch at a single point/vertex are not considered adjacent.)
Materials:
- Template
- Colored Pencils, Markers, or Crayons
Instructions:
- Analyze the Image and Identify Adjacencies
- Carefully examine the image.
- Identify all distinct regions.
- Determine which regions share a common border (these must have different colors).
- Attempt with Two Colors (Test for Bipartite Graphs)
- Start by trying to color the map using only two colors.
- Pick a region and assign it Color A.
- Assign Color B to all adjacent regions.
- Continue this process.
- If you reach a region that is adjacent to both Color A and Color B and must be one of those two colors, then two colors are not enough.
- Attempt with Three Colors
- If two colors didn’t work, try using three colors.
- Assign colors strategically, introducing the third color only when necessary (i.e., when a region is adjacent to two already-colored regions that are different from each other).
- Confirm with Four Colors
- If three colors prove insufficient, the Four Color Theorem guarantees that four colors will be enough.
- Use four colors to successfully color the map.
Understanding the Four Color Theorem
This challenge is based on the Four Color Theorem, a famous mathematical concept proposed by Francis Guthrie in 1852 and proven by Kenneth Appel and Wolfgang Haken in 1976. The theorem states:
Any map on a flat surface (or a sphere) can be colored using a maximum of four colors so that no two adjacent regions share the same color.
This applies to maps, puzzles, and diagrams where regions meet at borders (not just at a single point).
Extension:
Try creating your own map or diagram and testing different configurations to see how the number of required colors changes!
Real-World Correlations: The Unseen Applications of Map Coloring
The principles you’re applying in this challenge are vital in numerous practical applications:
- Cartography & Design: Ensuring clear visual distinction between geographical areas, or even different elements in a complex infographic or schematic.
- Computer Science:
- Frequency Allocation: Assigning radio frequencies to cell towers or TV stations so that nearby transmitters don’t interfere.
- Scheduling: Optimizing class timetables, airline routes, or factory production lines to avoid conflicts.
- Resource Management: Efficiently allocating limited resources (like computer memory registers) to different tasks.
- Logistics & Urban Planning: Designing efficient networks, delivery routes, or zoning plans where incompatible elements need to be separated.